TL;DR
- SRE team cut mean time to incident resolution by 40% using Claude for visual debugging
- Claude analyzes dashboard screenshots to diagnose issues tired humans miss at 2 AM
- MCP servers provide read-only kubectl access for safe automated investigation
- Best for: on-call SREs, infrastructure troubleshooting, Kubernetes cluster management
- Key insight: AI processes visual correlations and stays alert when humans are exhausted
An SRE resolved a 2 AM Kubernetes outage in 20 minutes by showing Claude a screenshot — the same diagnosis that usually takes an hour of manual documentation diving.
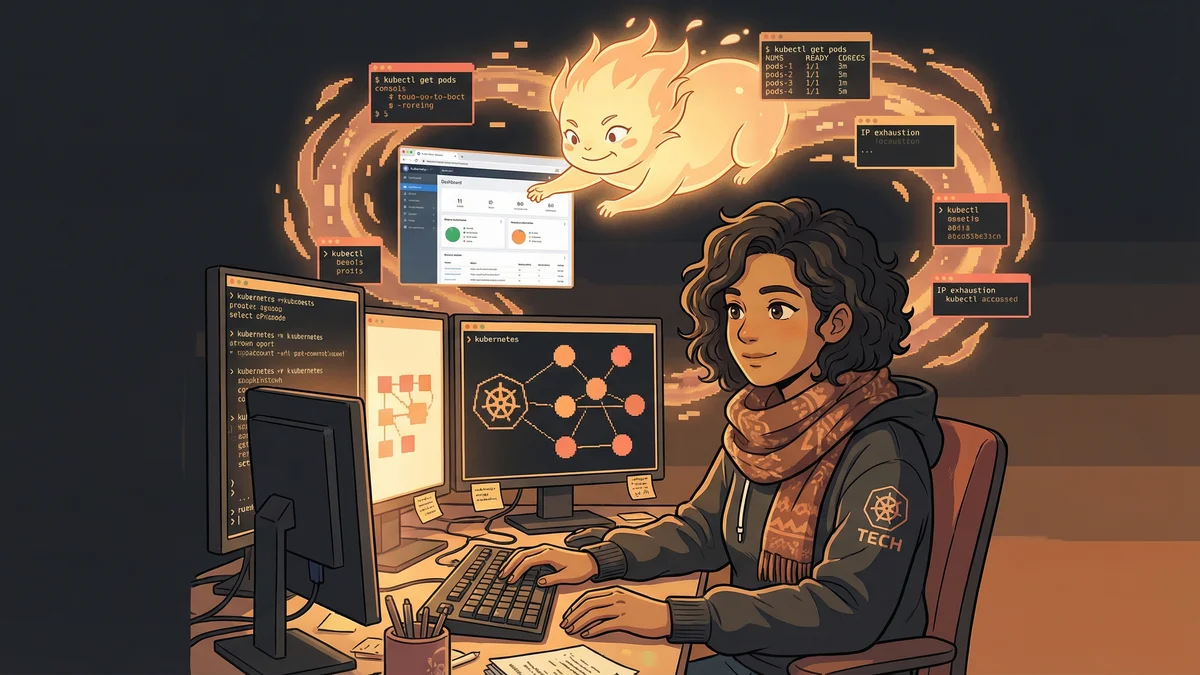
Elena’s pager went off at 2 AM.
“Pods failing to schedule. Cluster degraded. Customer impact reported.”
She stumbled to her laptop, eyes bleary, brain foggy. The Kubernetes dashboard showed red everywhere. Pods stuck in Pending. Nodes reporting resource pressure. The cluster was slowly dying.
“I’d been an SRE for six years. I’d seen this before. But at 2 AM, after a week of on-call incidents, my troubleshooting instincts were fried.”
She had a thought: what if Claude could look at what she was looking at?
The Screenshot Approach
Elena took a screenshot of the Google Cloud console showing the cluster status. Error messages. Resource graphs. Node health indicators.
She dropped it into Claude Code with a simple prompt: “I’m troubleshooting a Kubernetes cluster. Pods won’t schedule. What am I looking at?”
Claude analyzed the image.
“I can see your cluster is showing IP address exhaustion. The node pool has allocated all available IPs from its subnet. New pods can’t get addresses, so they stay Pending. Look at the IP allocation panel — you’re at 100% utilization.”
Elena blinked. She’d been staring at that dashboard for ten minutes, not registering what the numbers meant. Sleep deprivation had blinded her to the obvious.
“Claude saw what I couldn’t. Not because it’s smarter — because it wasn’t exhausted at 2 AM.”
The Fix
Claude didn’t just diagnose. It provided the remediation path.
“You need to either expand the subnet’s CIDR range or add a secondary IP range to the node pool. Here’s the gcloud command for adding a secondary range…”
The command was specific to her cluster configuration. Not a generic Stack Overflow answer — actual infrastructure surgery.
Elena ran the command. Waited for propagation. Watched the pending pods start scheduling.
“Incident resolved in 20 minutes. Usually, IP exhaustion troubleshooting takes an hour of digging through documentation. Claude cut through the noise.”
The Evolution
That incident changed Elena’s on-call strategy.
She started treating Claude as a visual debugger. When dashboards showed problems, she’d screenshot them instead of trying to describe them in words.
“Screenshots carry information that’s hard to verbalize. Color coding. Graph shapes. The relationship between panels. Claude processes all of it.”
Her workflow evolved:
- Notice something wrong on dashboard
- Screenshot the relevant views
- Ask Claude: “What’s causing this?”
- Get specific diagnosis and commands
- Execute and verify
The MCP Integration
Screenshots worked for diagnosis. But Elena wanted Claude to interact with her cluster directly.
She set up an MCP server exposing kubectl commands — read-only, for safety:
kubectl get pods— see pod statuskubectl describe node— inspect node healthkubectl logs— read application logskubectl get events— see cluster events
“Now Claude could investigate without me taking screenshots. I’d describe a symptom, and Claude would query the cluster itself.”
The investigations became richer. Claude would correlate information across multiple queries, building a picture no single dashboard showed.
The Memory Leak Detective
A week later, a different incident.
“Users reporting slow API responses. No obvious errors. Dashboard looks green. But something’s wrong.”
Elena asked Claude to investigate. It queried pod metrics, found memory trending upward in one deployment, correlated with response latency graphs.
“Your billing-service pods are experiencing memory leaks. Memory usage grows steadily after deploy, crossing 80% around hour 6. Response times degrade as pods approach memory limits. The pattern suggests a connection pool not releasing resources.”
Elena had the team investigate that specific service. They found an unclosed database connection in a rarely-triggered code path. Fixed and deployed.
“Claude didn’t fix the code. But it found the needle in a haystack of microservices. That correlation would have taken me hours manually.”
The Pattern Library
Elena built a library of infrastructure investigation patterns:
High Latency Pattern: “Screenshot the latency graph and the CPU/memory graphs for the relevant pods. Ask Claude to correlate.”
Pod Crash Pattern: “Query recent events and logs for the crashing pod. Ask Claude to identify the failure mode.”
Scaling Issues Pattern: “Screenshot the autoscaler metrics and pod resource requests. Ask Claude if sizing is appropriate.”
Network Problems Pattern: “Screenshot the network policy visualization and the denied connection logs. Ask Claude to trace the policy failure.”
“Each pattern is a recipe. Follow it, get answers faster than manual investigation.”
The Safety Boundaries
Elena was careful about what Claude could do.
Read-only kubectl access only. No kubectl delete. No kubectl exec. No commands that could make things worse.
“At 2 AM, I don’t trust myself to review every command carefully. I definitely don’t trust an AI to have write access to production.”
The constraint was strategic. Claude investigated. Elena executed. The human remained in the loop for any action with consequences.
The Knowledge Transfer
Elena noticed a side effect: she was learning.
Each Claude investigation came with explanations. Why this metric matters. What this error code means. How these components interact.
“I’d been an SRE for years, but Kubernetes is vast. Claude filled gaps in my knowledge by explaining its reasoning.”
She started treating investigations as teaching moments. “Explain why you concluded this.” Claude’s explanations became training material for junior SREs.
The Team Adoption
Other SREs noticed Elena resolving incidents faster.
“What’s your secret?”
She shared the workflow. Screenshot investigation. MCP kubectl access. Pattern library for common issues.
Within a month, the team’s mean time to resolution dropped by 40%. Not because Claude was magic — because it was consistent at 2 AM when humans weren’t.
The Unexpected Uses
The visual analysis capability extended beyond emergencies.
Capacity Planning: Screenshot resource utilization trends over weeks. Ask Claude to predict when you’ll need more capacity.
Architecture Review: Screenshot the service mesh visualization. Ask Claude to identify potential bottlenecks or single points of failure.
Cost Analysis: Screenshot cloud billing breakdown. Ask Claude to identify optimization opportunities.
“Claude became a second pair of eyes for anything with a visual component. Not just incidents — planning, review, analysis.”
The Limitations
The approach had boundaries.
Complex network issues sometimes needed packet captures that Claude couldn’t interpret. Deep security incidents required tools with forensic capabilities Claude lacked. Performance profiling at the code level needed flamegraphs and specialized tools.
“Claude is great for infrastructure-level investigation. For application-level debugging, you still need traditional profilers and debuggers.”
Elena learned to recognize when to hand off. Claude triaged and diagnosed. Specialists went deeper when needed.
The Philosophy Shift
Elena’s view of on-call changed.
“I used to dread incident response. Now I treat it as a collaboration. I’m not alone in the investigation — I have a partner that’s always alert, always patient, never tired.”
The stress didn’t disappear. But the cognitive load dropped. She could reserve her human judgment for decisions while offloading pattern recognition to Claude.
“Computers should do computer things. Finding correlations in data is a computer thing. Deciding whether to wake up the database team at 3 AM — that’s a human judgment.”
The Current Setup
Two years later, Elena’s team uses Claude as standard infrastructure tooling.
Every SRE has the MCP kubectl server configured. The pattern library has grown to 50+ investigation recipes. Claude handles first-pass analysis on most incidents.
“We’re still on call. We still get paged. But our incidents resolve faster, our post-mortems are richer, and our 2 AM selves are supported by an AI that never sleeps.”
The Kubernetes cluster that started it all? Still running. IP exhaustion resolved with a permanent subnet expansion that Claude helped plan.
“One screenshot at 2 AM saved the night. That’s when I became a believer.”