TL;DR
- Transformed 10 years of scattered markdown notes into a queryable knowledge graph
- Used Claude Code with Neo4j MCP server for automated concept extraction and relationship building
- Discovered unexpected connections between notes that search could never surface
- Best for: Researchers and knowledge workers with large note collections seeking hidden patterns
- Key lesson: Graph databases answer relationship questions that traditional search cannot
Building a personal knowledge graph with Claude Code and Neo4j transforms scattered notes into a navigable landscape where you can explore conceptual connections instead of just searching for keywords.
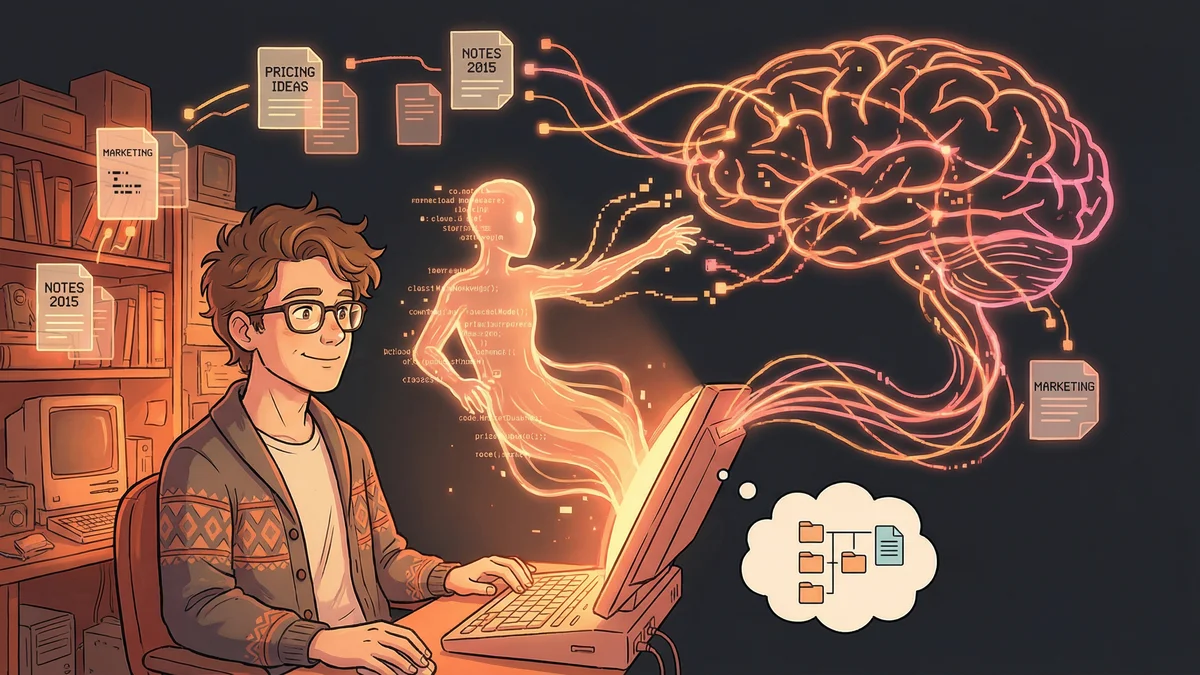
Priya had ten years of notes.
Research papers. Meeting summaries. Book highlights. Project learnings. Random ideas that seemed important at 2 AM.
Thousands of markdown files in her Obsidian vault. Connected by links she’d sometimes remembered to add. Unconnected more often than not.
“I knew the knowledge was in there. I’d written it all. But finding connections between ideas — that required remembering they existed and where I’d put them.”
Search helped for specific terms. But what about relationships? What connected to what? What themes emerged across hundreds of documents? Search couldn’t answer those questions.
The Graph Concept
Priya learned about graph databases. Structures designed to model relationships, not just data.
“Regular databases answer: ‘What are all the notes about machine learning?’ Graph databases answer: ‘What concepts connect to machine learning, and what connects to those concepts, and where do unexpected connections appear?’”
The difference was navigational. Graphs let you explore relationships that traditional search couldn’t surface.
She wondered: could she build a graph of her own knowledge?
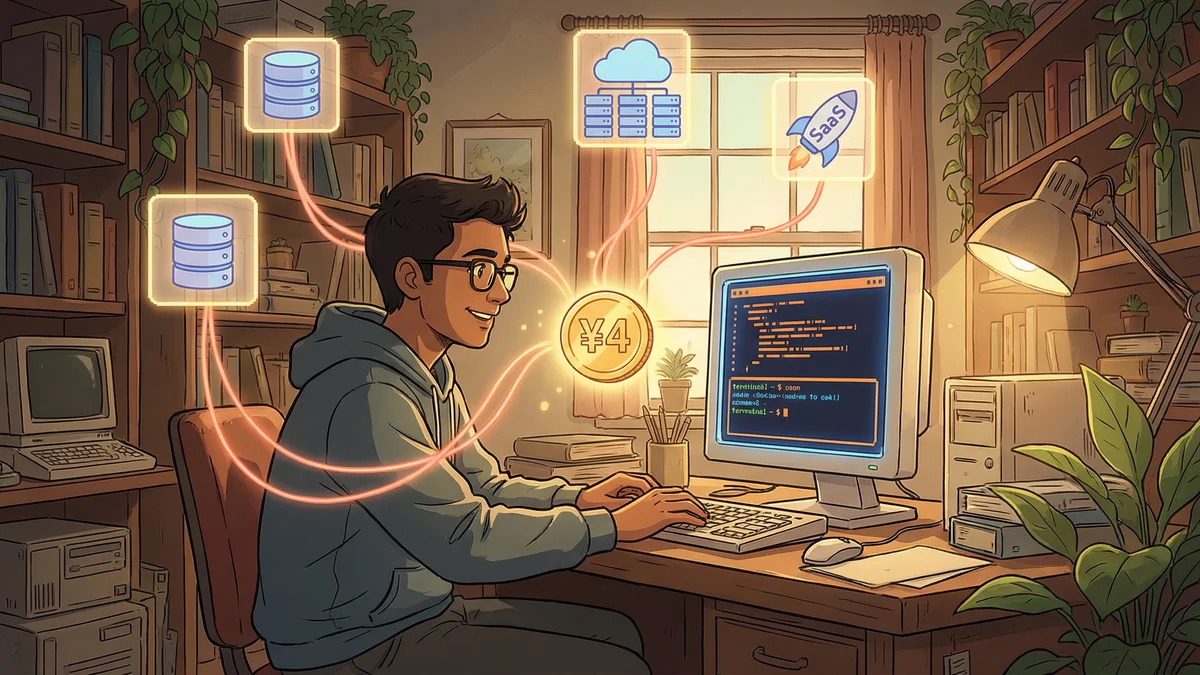
The Neo4j Discovery
Neo4j was the leading graph database. More importantly, someone had built an MCP server for it.
“An MCP server meant Claude could read and write to Neo4j directly. I could tell Claude to analyze my notes and build a knowledge graph — without writing database code myself.”
The pieces assembled:
- Obsidian vault with years of notes
- Neo4j database to store relationships
- Claude Code with MCP integration to connect them
The Initial Import
Priya started by importing her notes into the graph.
“Create a node for every note in my vault. Extract the title, key concepts mentioned, people referenced, and any existing links. Store them in Neo4j.”
Claude processed her vault. Thousands of nodes appeared — each representing a note. Edges appeared for explicit links between notes.
But that was just the beginning.
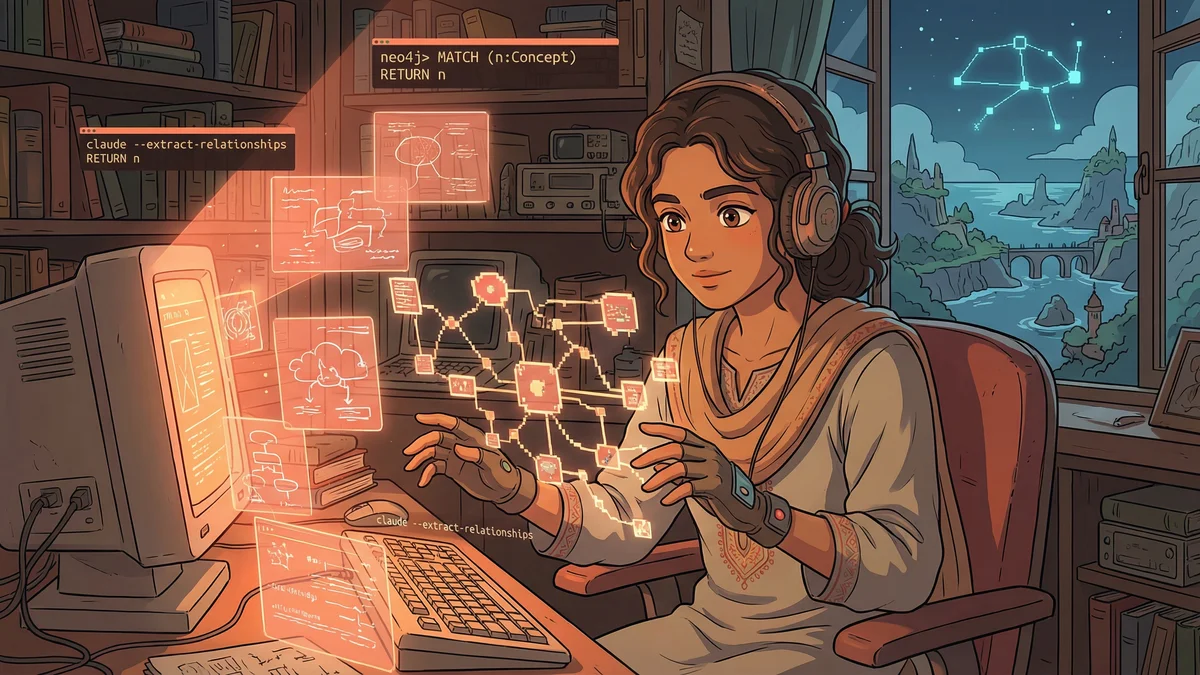
The Relationship Extraction
Explicit links were sparse. Implicit relationships were everywhere.
“My notes about ‘distributed systems’ and ‘team coordination’ never linked to each other. But they both referenced concepts of synchronization, timing, and coordination. They were connected — I just hadn’t connected them.”
Priya asked Claude to extract concepts:
“For every note, identify the main concepts, themes, and ideas discussed. Create nodes for these concepts. Create edges between notes and their concepts. Then create edges between concepts that appear together frequently.”
The graph transformed. Notes connected to concepts. Concepts connected to each other. A web of relationships emerged from what had been a pile of files.
The First Query
Priya asked her first graph question:
“What concepts connect my notes about ‘leadership’ to my notes about ‘software architecture’?”
The answer surprised her.
Leadership → delegation → system decomposition → software architecture Leadership → feedback loops → iterative design → software architecture Leadership → cognitive load → abstraction layers → software architecture
Three conceptual paths she’d never consciously drawn. Ideas she’d written years apart, in different contexts, now revealed as connected through shared concepts.
“I’d been thinking about the same things in different domains. The graph showed the underlying structure I couldn’t see.”
The Discovery Mode
Priya started exploring.
“What’s the most connected concept in my vault?” → Communication. It appeared in notes about software, leadership, relationships, writing.
“What notes are surprisingly disconnected?” → Several orphans that discussed important topics but had no concept overlap with the rest. Either they needed linking or they didn’t belong.
“What are the shortest paths between random pairs of notes?” → Surprisingly few steps. Her knowledge was more integrated than she’d realized.
The Research Application
The graph transformed how Priya did research.
Starting a new project, she’d query: “What do I already know about [topic]? Show me all notes within two relationship steps.”
The graph would return not just notes directly tagged with the topic, but notes connected through shared concepts. Adjacent knowledge she’d forgotten existed.
“I stopped starting from zero. The graph surfaced my existing knowledge before I went looking for new information.”
The Synthesis Capability
Beyond discovery, the graph enabled synthesis.
“Based on the relationship structure, what are the major themes in my vault? What concepts cluster together?”
Claude analyzed the graph topology. Identified clusters of densely connected concepts. Named the themes based on what the clusters contained.
Theme 1: Leadership and Organization (nodes: delegation, feedback, teams, structure…) Theme 2: Technical Systems (nodes: architecture, scalability, abstraction, interfaces…) Theme 3: Creative Process (nodes: writing, iteration, inspiration, constraints…)
“The AI discovered the structure of my thinking. Not what I said I was interested in — what my actual notes revealed I’d spent time on.”
The Question-Answering
The graph enabled a new type of Q&A.
Traditional: “What did I write about X?” → Search and retrieve Graph-enhanced: “How does X relate to Y in my notes?” → Traverse relationships
Priya could ask: “What’s the relationship between my thinking on ‘feedback’ and ‘writing’?”
The answer came as a path: Feedback → iterative improvement → revision → writing process
“It was like having a conversation with my past self, mediated by the structure of my own ideas.”
The Maintenance Challenge
Graphs needed maintenance.
New notes didn’t automatically integrate. Concepts evolved. Old categorizations became stale.
Priya created a weekly ritual:
“For all notes added this week, extract concepts and add them to the graph. Identify any concept drift — terms I’m using differently now than before. Suggest edge updates.”
The graph stayed current through regular feeding. Like any knowledge system, it required cultivation.
The Visualization Experiment
Priya experimented with visualizing the graph.
Neo4j had visualization tools. She could see her knowledge as a network — dense clusters of related ideas, sparse bridges between domains, unexpected connections glowing like new routes on a map.
“Seeing the structure changed how I thought about it. I could literally see where my knowledge was deep and where it was thin.”
The visual map guided her learning. Sparse areas suggested gaps to fill. Disconnected clusters suggested bridges to build.
The Integration Workflow
The graph integrated with her daily practice.
Morning: “What in my knowledge base relates to today’s focus areas?” During work: Notes automatically tagged for later graph integration Evening: New notes processed, graph updated, relationships discovered
“The graph became the connective tissue for my intellectual life. Notes went in, relationships came out.”
The Limitation Acknowledgment
The system wasn’t perfect.
Concept extraction was imprecise. Sometimes Claude identified false connections. Sometimes meaningful relationships were missed.
“I reviewed the AI-generated relationships periodically. Removed false positives. Added missed connections. The graph was more accurate with human curation.”
The AI did the heavy lifting. Human judgment refined the results.
The Unexpected Benefit
Beyond organization, the graph changed Priya’s thinking.
“When you see your ideas as connected, you think in connections. I started noticing relationships between concepts as I encountered them. The graph trained my brain to see patterns.”
The tool shaped the user. The act of maintaining a knowledge graph made her more aware of conceptual structure.
The Recommendation
For others building knowledge graphs:
“Start with a corpus. You need content before you can extract structure. If you have years of notes, you’re ready. If you’re starting fresh, build the habit first.”
“Use MCP integration so Claude can directly access the database. Manual import/export creates friction that kills the practice.”
“Query the graph regularly. A graph you don’t explore is just expensive storage. The value is in discovery, not accumulation.”
“Accept imperfection. The graph will have errors. Prune them over time. A messy graph is more useful than no graph.”
The Current State
Three years of graph building later, Priya had a queryable knowledge base.
Thousands of notes. Tens of thousands of relationships. Concepts emerged, clustered, connected.
“I don’t search my notes anymore. I explore my knowledge. That’s a different experience entirely.”
The scattered files became a navigable landscape. The vault became a second brain that could actually answer questions about itself.